Performance Science
·14 min read
8 Most Important Indicators of Efficient Oxygen Transport
From Cardiac Output to Capillary Density: The Science of Getting Oxygen Where It Needs to Go—and How AI-Powered Longevity Planning Is Turning Data Into Decades
By Tony Medrano, CEO & Co-Founder, LongevityPlan.AI

8 Most Important Indicators of Efficient Oxygen Transport in the Cardiovascular System for Endurance Athletes
From Cardiac Output to Capillary Density: The Science of Getting Oxygen Where It Needs to Go—and How AI-Powered Longevity Planning Is Turning Data Into Decades
By Tony Medrano, CEO & Co-Founder, LongevityPlan.AI
Introduction: The Oxygen Paradox
Here is a number that should stop you mid-sip of your morning coffee: three weeks of complete bed rest, imposed on healthy 20-year-old men in the landmark 1966 Dallas Bed Rest and Training Study, reduced their maximal oxygen uptake (VO2max) by a staggering 27 percent—a decline greater than what 30 years of normal aging inflicted on the same subjects when they were re-tested at age 50. [1] The study, originally conducted by Bengt Saltin and colleagues and later followed up by Benjamin Levine, M.D., at the University of Texas Southwestern Medical Center, remains one of the most cited papers in exercise physiology for a simple reason: it proved that the cardiovascular system's capacity for oxygen transport is breathtakingly plastic—for better and for worse.
Subsequent endurance training in those same subjects increased maximal cardiac output by 40 percent, with VO2max climbing 45 percent above post-bed-rest values. [2] Stroke volume, not heart rate, drove the improvement. The heart literally grew, relaxed faster, and pumped more blood per beat. As Levine later observed, masters-level endurance athletes had hearts "virtually identical" to those of healthy young adults—exercise had effectively reversed the calendar. [3]
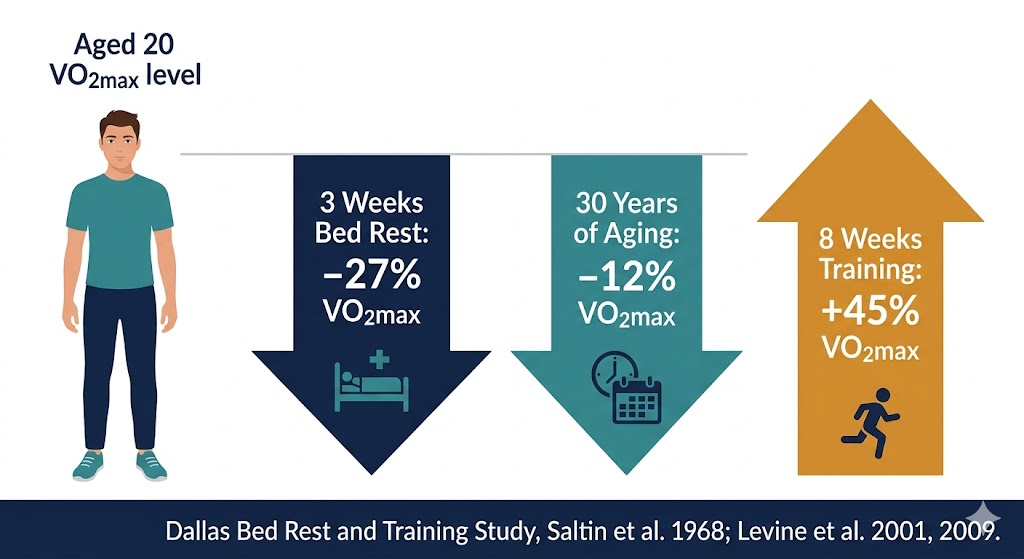
Figure 1. The Dallas Bed Rest Study revealed that just three weeks of complete inactivity reduced VO₂max more than three decades of normal aging — but structured endurance training reversed the decline entirely. Data: Saltin et al., Circulation 1968; Levine et al., Circulation 2019.
The eight indicators we explore in this article represent the links in a chain that connects your lungs to your mitochondria. Break any link—or fail to monitor it—and performance stalls and healthspan contracts. Monitor all eight with multi-modal health data from a robust sensor layer and feed them into an intelligence layer capable of predictive modeling, and you have the foundation of what we at LongevityPlan.AI call a Cardiorespiratory Digital Twin™—a living, breathing computational model of your cardiovascular system that evolves with every training session, recovery night, and biomarker panel.
This article is for the 52-year-old CEO training for her first Ironman, the college cross-country runner trying to earn a Stanford scholarship, the NASA flight surgeon monitoring astronaut deconditioning, and the Corporate Wellness Program director wondering why half the sales team can't walk up two flights of stairs without panting. The science applies equally; the interventions must be personalized. That is the central promise of a Digital Twin for Predictive Performance™.
Indicator 1: Maximal Oxygen Uptake (VO₂max)
If the cardiovascular system is an orchestra, VO2max is the standing ovation—the integrated output of lungs, heart, vasculature, and muscle mitochondria all performing in concert. Michael J. Joyner, M.D., the Frank R. and Shari Caywood Professor of Anesthesiology at the Mayo Clinic and one of the world's foremost authorities on human performance, has spent decades demonstrating that VO2max is "one of the variables that sets the physiological upper limit for sustained energy production by the contracting skeletal muscles." [4]
How trainable is it? A 2013 meta-analysis led by Joyner's lab at Mayo Clinic analyzed interval-training studies from 1965 to 2012 and found that high-intensity protocols produced average VO2max gains of roughly 0.51 L/min, with a subset of studies using longer intervals showing gains of 0.8–0.9 L/min—improvements that appeared across virtually all subjects. [5] This challenges the persistent myth that some people are "non-responders" to training; the more likely explanation is that many prior studies simply did not prescribe enough intensity.
But genetics still matters. Claude Bouchard, Ph.D., at the Pennington Biomedical Research Center, led the HERITAGE Family Study—the largest controlled exercise-training study ever conducted in families—and demonstrated that the heritability of VO2max trainability is approximately 47 percent, with a notable maternal transmission component of 28 percent that hints at mitochondrial DNA involvement. [6] Among 481 subjects who completed 20 weeks of standardized cycling, the mean improvement was 400 mL/min, but some gained over 1.0 L/min while others gained almost nothing.
This heterogeneity is precisely why a one-size-fits-all training program fails. A Coach / Practitioner armed with longitudinal VO2max data, wearable-derived heart-rate kinetics, and genomic markers can identify an Athlete / Patient's position on the responder continuum and adjust volume, intensity, and recovery windows accordingly. Platforms such as InsideTracker already integrate blood biomarkers with wearable data to model aerobic fitness trajectories; Fountain Life pairs gold-standard CPET testing with full-body MRI and AI-driven risk scoring. LongevityPlan.AI's approach extends this by layering wearable sensor data into a continuously updated digital twin, so the model improves with every workout, not just every clinic visit.
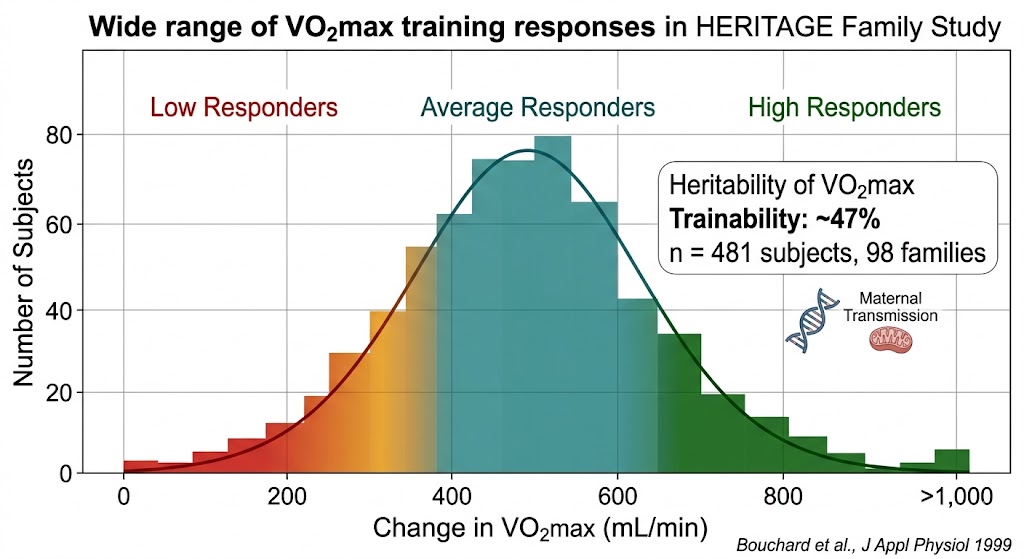
Figure 2. The HERITAGE Family Study demonstrated enormous inter-individual variability in VO₂max training response — some subjects gained over 1.0 L/min while others showed minimal improvement, with approximately 47% of the variation attributable to genetic factors. This is why personalized, AI-driven training prescription outperforms one-size-fits-all programs. Data: Bouchard et al., Journal of Applied Physiology 1999.
Indicator 2: Cardiac Output and Stroke Volume
VO2max is the headline; cardiac output is the engine. As Ilkka Heinonen, Ph.D., of the Turku PET Centre at the University of Turku (Finland), articulated in a 2025 review in Experimental Physiology: "It is widely considered and accepted that an important factor limiting VO2max is maximal cardiac output, the ability of the heart to pump blood and thus oxygen to maximally working skeletal muscles." [7]
Untrained adults produce a maximal cardiac output of roughly 15–25 L/min. Elite endurance athletes can reach 30–40 L/min. The distinction is almost entirely attributable to stroke volume—the quantity of blood ejected per heartbeat—not heart rate, which actually tends to decline with endurance training. [8] Heinonen's research using positron emission tomography reveals that trained hearts exhibit enhanced myocardial oxygen extraction (a fractional extraction of 60–80 percent even at rest) and lengthened capillary mean transit times, permitting more efficient oxygen exchange within the heart muscle itself. [9]
The clinical implication is profound: maximal heart rate is not something you can or should try to increase. Your heart's own blood supply occurs almost exclusively during diastole (the relaxation phase), and increasing heart rate shortens that window. Levine's research has shown that the hallmark of the endurance-trained heart is eccentric hypertrophy—the ventricles enlarge, become more compliant, relax quickly, and fill with greater volumes of blood. [10] This is a structural adaptation that takes years to develop and that, once lost to deconditioning, can take months of dedicated training to restore.
Wearable technology is rapidly closing the gap between laboratory hemodynamics and field-based monitoring. Catapult Sports now deploys inertial-measurement-unit vests across professional soccer and rugby leagues, combining GPS-derived external load with accelerometer-based cardiac-demand proxies. Polar Electro's Precision Prime technology in its latest Loop band tracks heart rate and heart-rate variability continuously, feeding data into algorithms developed by Firstbeat Technologies (now a Garmin subsidiary) that estimate training load and recovery status. These sensor-layer outputs become the raw substrate for an intelligence layer: the predictive modeling engine that can forecast when an athlete's cardiac output reserve is depleted before the athlete subjectively feels fatigued.
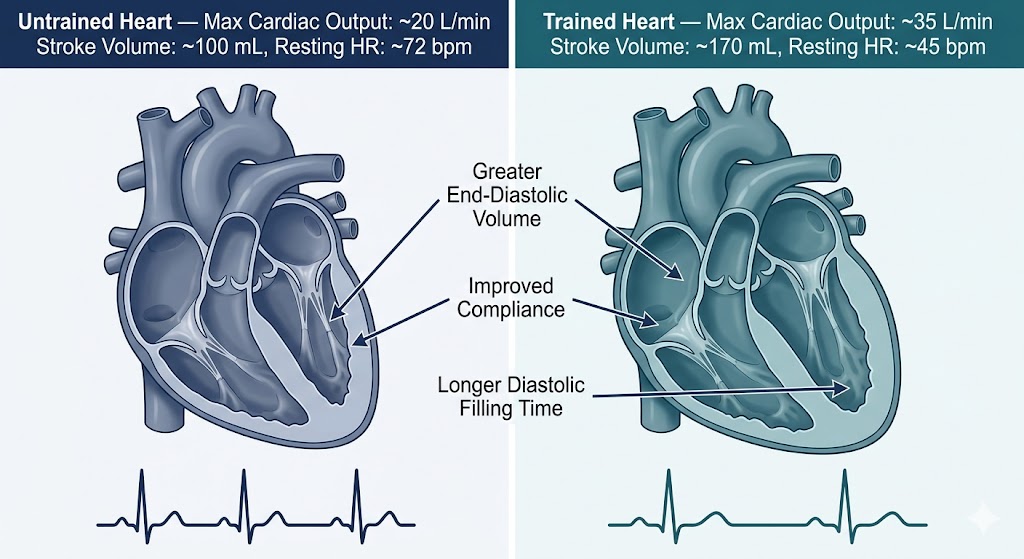
Figure 3. Endurance training produces eccentric cardiac hypertrophy — the ventricles enlarge and become more compliant, dramatically increasing stroke volume. An elite endurance athlete's heart can pump nearly double the cardiac output of a sedentary adult, driven entirely by stroke volume adaptations rather than increased heart rate. Adapted from Heinonen, Experimental Physiology 2025; Martinez et al., JACC 2021.
Indicator 3: Hemoglobin Concentration and Oxygen-Carrying Capacity
Every molecule of hemoglobin can bind four molecules of oxygen. The total oxygen-carrying capacity of blood is therefore a direct function of hemoglobin concentration, and even small perturbations—iron deficiency, altitude acclimatization, erythropoietin signaling—shift the equation measurably. The 2021 JACC State-of-the-Art Review on exercise-induced cardiovascular adaptations, authored by Matthew W. Martinez and a panel that included Levine and Aaron L. Baggish of the University of Lausanne, noted that exercise training increases circulating blood volume by approximately 20–25 percent, effectively expanding the oxygen-transport reservoir. [11]
Joyner's work at Mayo has shown that arterial oxygen content is maintained near resting levels in most exercising individuals but can drop in some elite aerobic athletes—a phenomenon called exercise-induced arterial hypoxemia, which may limit performance at the extreme end of the spectrum. [12] Monitoring hemoglobin and hematocrit levels through regular blood panels is therefore non-negotiable for serious endurance athletes. Function Health, which provides over 100 biomarker tests in a single draw, makes this practical at scale. Dexcom's continuous glucose monitors, while not measuring hemoglobin directly, demonstrate the power of continuous biomarker tracking; the endurance world is eagerly awaiting similarly non-invasive, continuous hemoglobin sensors.
Epicore Biosystems, a spin-out from Northwestern University, is developing sweat-sensing microfluidic patches that can track chloride, lactate, and creatinine in real time. The Harvard Wyss Institute for Biologically Inspired Engineering has published work on flexible electronic skin sensors capable of measuring blood oxygenation transcutaneously. These technologies promise to feed hemoglobin-related data into the sensor layer of a cardiorespiratory digital twin without requiring a blood draw—a paradigm shift for both the Athlete / Patient and the Coach / Practitioner.
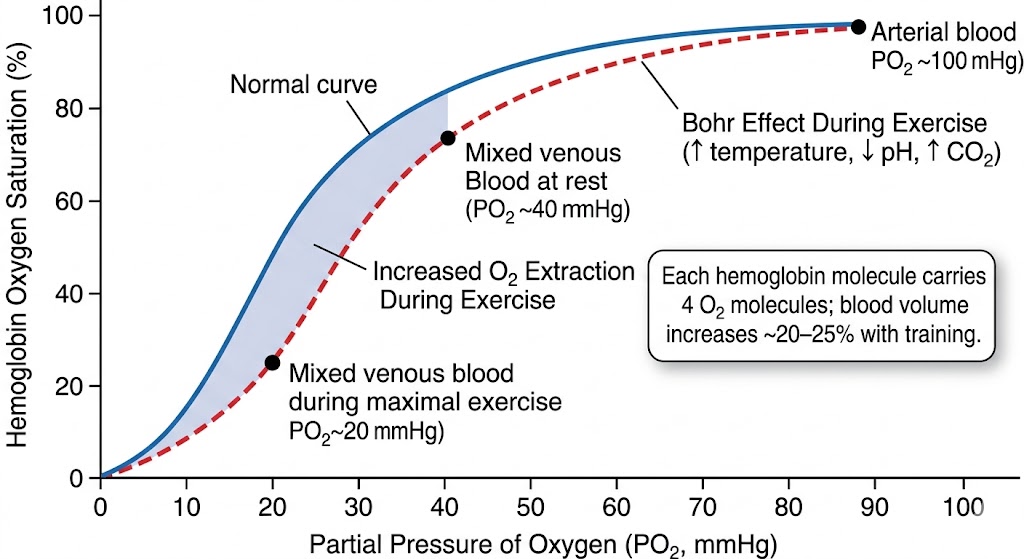
Figure 4. The oxygen-hemoglobin dissociation curve shifts rightward during exercise (the Bohr effect), facilitating greater oxygen release to working muscles. Endurance training expands blood volume by 20–25%, amplifying total oxygen-carrying capacity. Monitoring hemoglobin concentration and SpO₂ through wearables and blood panels is essential for optimizing this critical link in the oxygen-transport chain.
Indicator 4: Arteriovenous Oxygen Difference (a-vO₂ Difference)
The a-vO2 difference quantifies how effectively working muscles extract and consume oxygen from the blood passing through them. At rest, roughly 25 percent of delivered oxygen is extracted; during maximal exercise in a trained individual, that figure can reach 75–85 percent. [13] Interestingly, the Dallas Bed Rest Study's 30-year follow-up revealed that the decline in VO2max with aging was driven primarily by a drop in maximal a-vO2 difference—peripheral oxygen extraction deteriorated—while maximal cardiac output was actually maintained because a decline in heart rate was compensated by increased stroke volume. [14]
This finding has enormous implications for longevity planning. It suggests that for the aging endurance athlete or executive, the bottleneck shifts from the heart to the muscles—specifically, to mitochondrial density, capillary-to-fiber ratio, and the enzymatic machinery of oxidative phosphorylation. George A. Brooks, Ph.D., the legendary UC Berkeley exercise physiologist who redefined our understanding of lactate metabolism, has argued for decades that the lactate shuttle represents a critical pathway by which exercising muscles communicate their metabolic status. Training the peripheral extraction apparatus through targeted Zone 2 work and high-intensity interval sessions is the evidence-based prescription.
Near-infrared spectroscopy (NIRS) devices, such as those from the Artinis Medical Systems platform and the Moxy Monitor, can now measure local muscle oxygen saturation in real time during exercise. The University of Copenhagen's Muscle Research Centre, long directed by Ylva Hellsten, Ph.D., has used NIRS and invasive catheter techniques to demonstrate that exercise training enhances skeletal muscle capillarization and nitric oxide–mediated vasodilation, both of which expand the a-vO2 difference. [15] As these sensors miniaturize and integrate with consumer platforms, the Athlete / Patient's digital twin gains a critical new data channel.
Indicator 5: Oxygen Uptake Kinetics
How quickly your body ramps up oxidative metabolism at the onset of exercise determines how large your "oxygen deficit" will be—the energy gap that must be filled by anaerobic pathways. Faster VO2 kinetics mean a smaller deficit, less reliance on glycolysis, lower lactate accumulation, and greater exercise tolerance. Andrew M. Jones, Ph.D., of the University of Exeter, and David C. Poole, Ph.D., of Kansas State University, have spent over two decades mapping this terrain. Their seminal work, published in Comprehensive Physiology, established that in healthy individuals performing upright locomotion, VO2 kinetics control resides within the exercising muscles themselves—not in upstream oxygen-transport systems. [16]
However, disease, aging, and deconditioning can shift the locus of control proximally. In chronic heart failure patients, slowed cardiac output responses delay oxygen delivery to muscle; in type 2 diabetes, impaired microvascular function limits capillary oxygen extraction. [17] Jones's work with elite runners—including the former women's marathon world record holder Paula Radcliffe—demonstrated that directed training over 15 years produced a 15 percent improvement in running economy, tightly linked to optimized VO2 kinetics. [18]
For AI-powered coaching improvements, VO2 kinetics data is gold. Platforms such as WHOOP already derive strain scores from continuous heart-rate data; Garmin and Suunto estimate aerobic and anaerobic training effects from similar inputs. The next frontier is integrating NIRS-based muscle oxygenation with cardiac output proxies to model the VO2 on-kinetics response at the individual level. The Stanford University Human Performance Alliance, in collaboration with the MIT Media Lab, is pursuing exactly this kind of multi-sensor fusion. When those signals reach a predictive-modeling engine, the Coach / Practitioner receives actionable alerts: "Your client's Phase II time constant has drifted from 22 seconds to 31 seconds over the past four weeks—consider adding short-interval sessions above critical power."
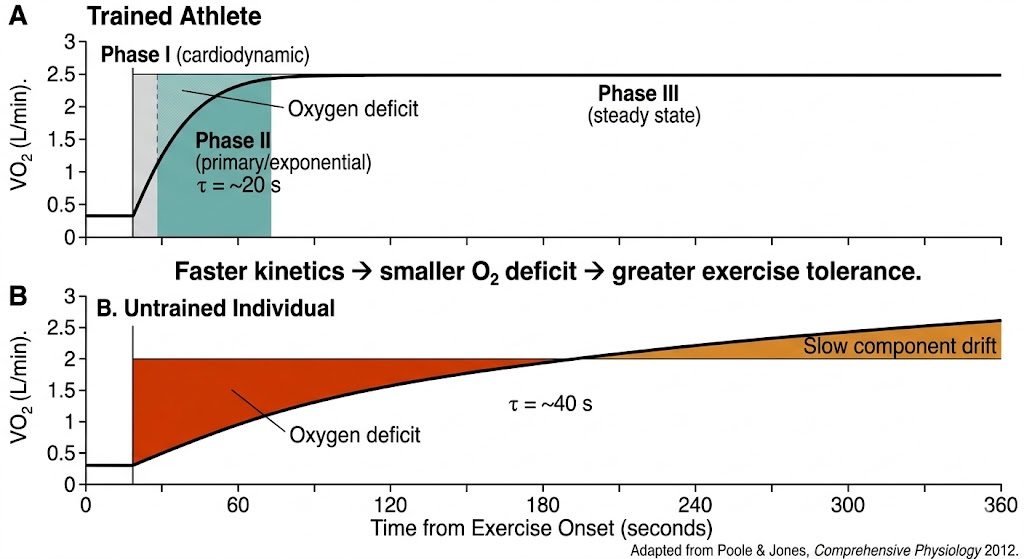
Figure 5. Oxygen uptake kinetics — the speed at which VO₂ rises at exercise onset — differs dramatically between trained and untrained individuals. A faster Phase II time constant (τ) means a smaller oxygen deficit, less anaerobic energy contribution, and superior exercise tolerance. AI-powered wearable analysis of heart-rate on-kinetics can approximate this lab metric in the field. Adapted from Poole & Jones, Comprehensive Physiology 2012.
Indicator 6: Ventilatory Efficiency (VE/VCO₂ Slope)
Every liter of oxygen consumed requires moving air in and out of the lungs—and not all ventilation is created equal. The ventilatory equivalent for CO2 (VE/VCO2) slope quantifies how much breathing you need for a given level of metabolic CO2 production. A steeper slope (higher number) means less efficient gas exchange—a hallmark of heart failure, pulmonary hypertension, and deconditioning. Karlman Wasserman, M.D., Ph.D., who pioneered cardiopulmonary exercise testing at Harbor-UCLA Medical Center, developed the framework of ventilatory thresholds that clinicians worldwide now use to diagnose exercise intolerance. His concept of the Oxygen Uptake Efficiency Slope (OUES) integrates cardiovascular, pulmonary, and skeletal-muscle function into a single index that can be derived from submaximal exercise—no heroic sprinting to exhaustion required. [19]
Jerome A. Dempsey, Ph.D., of the University of Wisconsin-Madison, has spent a career demonstrating that the respiratory system can itself become a limiting factor at extreme exercise intensities, particularly in highly trained women and in athletes at altitude. His concept of "expiratory flow limitation" explains why some elite athletes literally cannot move air fast enough to keep up with metabolic demand. For the aging executive or weekend warrior, the respiratory limitation manifests differently: diaphragmatic weakness, reduced chest-wall compliance, and ventilation-perfusion mismatch in the aging lung.
Respiratory monitoring has historically required a metabolic cart—a hospital-grade device costing upwards of $30,000. But Zephyr (now part of Medtronic) pioneered chest-worn bioharness technology that captures breathing rate, tidal volume estimates, and posture for military and athletic populations. Biofourmis, based in Boston, applies FDA-cleared biosensors and machine-learning algorithms to continuous respiratory-rate data for remote patient monitoring. As respiratory signals become part of the wearable sensor layer, ventilatory efficiency becomes a trackable, trainable, and predictable metric within the digital twin.
Indicator 7: Capillary Density and Microvascular Function
Oxygen's final journey—from the red blood cell through the capillary wall, across the interstitial space, and into the mitochondrion—is governed by Fick's law of diffusion. The surface area for this exchange is determined by capillary density: the number and total cross-sectional area of capillaries surrounding each muscle fiber. Bengt Saltin (1935–2014), the Copenhagen-based father of modern exercise physiology, demonstrated that endurance training can increase skeletal-muscle capillary density by 20–40 percent, and that this adaptation is a primary driver of improved oxygen extraction at the periphery. [20]
Poole's work at Kansas State University has added mechanistic depth, showing that the three-dimensional architecture of the arteriolar tree—not merely capillary number—determines the dynamic matching of oxygen delivery to metabolic demand in contracting muscle. The trained state enhances endothelium-dependent vasodilation (largely nitric oxide–mediated), reduces extravascular compressive forces, and improves the kinetics of local blood flow redistribution. [21]
Loughborough University's Sports Technology Institute in the United Kingdom is exploring non-invasive microvascular-imaging techniques that could eventually allow field-based assessment of capillary density. Imperial College London's Sports Tech Lab has combined thermal imaging with NIRS to create composite maps of local perfusion during exercise. ETH Zurich is developing computational models of oxygen transport in the microvasculature that can be parameterized by individual biopsy data or, increasingly, by non-invasive sensor inputs. These academic efforts foreshadow a future in which capillary function is no longer a hidden variable but a visible, manageable component of your digital twin.
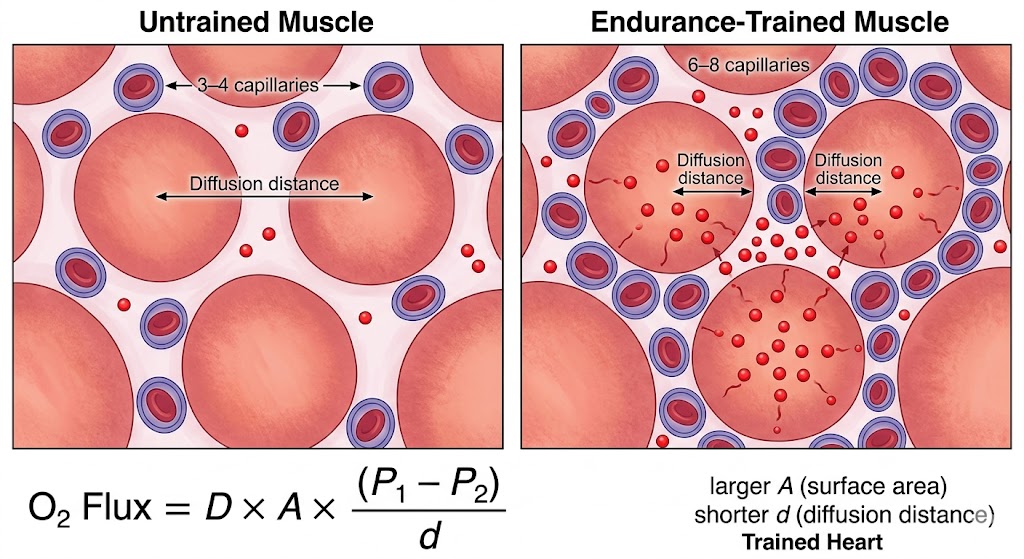
Figure 6. Endurance training increases skeletal-muscle capillary density by 20–40%, expanding the surface area for oxygen diffusion and shortening the distance oxygen must travel from blood to mitochondria. This peripheral adaptation is a primary driver of the arteriovenous oxygen difference and becomes increasingly important for performance as athletes age. Based on foundational work by Saltin and colleagues.
Indicator 8: Mitochondrial Density and Oxidative Enzyme Activity
The mitochondrion is where oxygen meets purpose. Without adequate mitochondrial density and the enzymatic capacity to process oxygen through the electron transport chain, all upstream delivery is wasted. Zhen Yan, Ph.D., at the University of Virginia, has published extensively on the molecular mechanisms by which exercise stimulates mitochondrial biogenesis, particularly through the PGC-1α signaling cascade. [22] His work demonstrates that both endurance training and high-intensity interval training activate distinct but overlapping mitochondrial remodeling pathways.
The practical implication: mitochondrial adaptation is not one-dimensional. Zone 2 training (the low-intensity, high-volume work that Dr. Peter Attia and Iñigo San Millán popularized) preferentially enhances fat oxidation and mitochondrial efficiency, while HIIT stimulates mitochondrial fission, fusion, and quality control through autophagy. An optimal longevity-oriented training program must include both modalities—the "training paradox" that Tony Medrano has explored in previous editions of this newsletter.
Measuring mitochondrial function non-invasively is an active frontier. NIRS-based protocols, as validated by researchers at the University of Georgia and at Loughborough, use short arterial occlusions post-exercise to track the rate of muscle oxygen consumption recovery—a proxy for mitochondrial capacity. Omegawave, a Finnish technology company originally developed for Soviet sports science, combines heart-rate variability with bioelectrical impedance to estimate readiness, which correlates with oxidative-metabolic status. The Carnegie Mellon University Human-Computer Interaction Institute is exploring how machine-learning models trained on wearable time-series data can infer mitochondrial phenotype from surface-level physiological signals.
For the longevity-minded reader: mitochondrial density declines with age at a rate of roughly 8–10 percent per decade after age 30. This decline is accelerable by inactivity and partially reversible by training. It is also increasingly amenable to pharmacological and nutritional intervention—nicotinamide riboside, urolithin A (Amazentis/Timeline Nutrition), and the mitochondrial-targeted peptide SS-31 (elamipretide) are all in various stages of clinical investigation. An AI-powered longevity platform that integrates training data, mitochondrial-proxy metrics, and supplement protocols could provide unprecedented granularity in personalizing the fight against age-related mitochondrial decline.
Putting It All Together: The Eight-Link Chain in Practice
Think of these eight indicators as a supply chain for the most critical commodity in human physiology: molecular oxygen. Any bottleneck—a stiff, non-compliant left ventricle; a hemoglobin deficit from subclinical iron deficiency; sparse capillaries in deconditioned quadriceps; sluggish mitochondrial electron transport—throttles the entire system. The genius of the Fick equation (VO2max = Cardiac Output × a-vO2 Difference) is its elegant simplicity; the challenge is that each term on the right side is itself a composite of dozens of upstream variables.
This is where data-driven longevity planning earns its keep. A single VO2max test tells you the headline. Pair it with an echocardiogram (stroke volume, diastolic function), a blood panel (hemoglobin, ferritin, inflammatory markers), wearable-derived heart-rate kinetics (VO2 on-kinetics proxies), NIRS muscle-oxygenation data, and a respiratory-rate profile, and you have a high-resolution map of the entire oxygen-transport chain. Feed all of that into a machine-learning model that compares your trajectory against population norms and, more powerfully, against your own historical data, and you have something genuinely new: a predictive modeling engine that can identify the rate-limiting step in your personal physiology and recommend the precise intervention to address it.
How Leading Companies Are Turning Oxygen-Transport Science into Products
The Sensor Layer: Who's Capturing the Data
WHOOP's 5.0 platform now tracks heart rate, HRV, SpO2, respiratory rate, and skin temperature continuously, using pulse oximetry that differentiates oxygenated from deoxygenated hemoglobin via red and infrared LEDs. [23] Garmin's integration of Firstbeat Technologies' algorithms powers VO2max estimation, training-load quantification, and recovery-time predictions across its Forerunner and Fenix lines. Polar Electro, the Finnish pioneer that introduced the first wireless heart-rate monitor in 1982, now competes directly in the 24/7 health-band market. Apple continues to expand health capabilities with blood-oxygen sensing and atrial-fibrillation detection. These companies form the sensor layer of the emerging cardiorespiratory data ecosystem.
The Intelligence Layer: Who's Making Sense of It
Google DeepMind Health has published research on using machine learning to predict acute kidney injury from electronic health records and is now extending similar approaches to cardiorespiratory risk. Tempus Labs (founded by Eric Lefkofsky) applies AI to genomic and clinical data to personalize oncology treatment; its infrastructure could readily extend to cardiopulmonary phenotyping. Twin Health uses whole-body digital-twin technology specifically for metabolic disease reversal, integrating continuous glucose monitoring with wearable activity data. Insilico Medicine applies generative AI to drug discovery, including targets relevant to cardiovascular aging and mitochondrial dysfunction.
Smaller innovators are carving out niches: Infinite Athlete (which absorbed Tempus Ex) provides real-time analytics to NFL and college football teams, including workload and fatigue monitoring that maps directly onto cardiac-output demand curves. Valencell, based in North Carolina, licenses its advanced PPG sensor technology to third parties and has validated ear-worn sensors that correlate strongly with clinical-grade pulse oximetry. LifeBEAM integrated optical sensors into cycling helmets and military helmets, proving that sensor placement can be as important as sensor quality.
LongevityPlan.AI: Bridging the Gap
Where LongevityPlan.AI differentiates is at the intersection of these layers: consuming raw data from best-in-class sensors (WHOOP, Garmin, Oura, Apple Watch, Dexcom), enriching it with clinical biomarkers and medical records, and generating a continuously updated digital twin that provides AI-powered coaching improvements for both the individual and their care team. The platform is designed to serve the Coach / Practitioner as much as the Athlete / Patient—because the best data in the world is useless if it cannot be translated into an actionable training prescription or a clinical referral at the right moment.
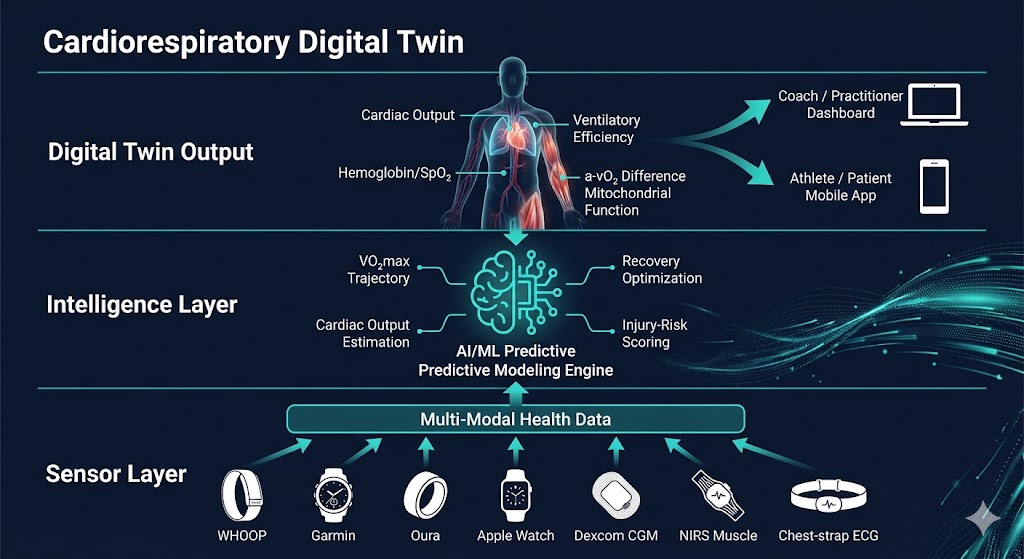
Figure 7. Architecture of the Cardiorespiratory Digital Twin™. Wearable sensors and clinical biomarkers form the sensor layer, feeding multi-modal health data into an AI-powered intelligence layer that generates predictive models for each of the eight oxygen-transport indicators. The result is a continuously updated digital replica that serves both the Coach / Practitioner and the Athlete / Patient with actionable insights.
The Genetics Dimension: Why Personalization Is Not Optional
Bouchard's HERITAGE data makes an irrefutable case: genetic variation accounts for roughly half of the inter-individual differences in how the cardiovascular system responds to training. Some people are genetically predisposed to build large, compliant hearts; others will see their primary gains at the peripheral level. A Corporate Wellness Program that prescribes the same 150-minutes-per-week walking program to every employee is ignoring this reality. An AI system that ingests genomic data alongside wearable and biomarker inputs can stratify employees—or patients, or athletes—into training-response phenotypes and tailor interventions accordingly.
The Australian Institute of Sport (AIS) was one of the first national programs to integrate genetic testing with training prescription at scale, identifying polymorphisms in the ACE, ACTN3, and PPARGC1A genes that influence endurance capacity. The University of Cambridge is applying machine-learning models to UK Biobank's cardiovascular data—including VO2max estimates derived from submaximal exercise tests—to discover novel genetic associations. The University of Oxford's physiology department, in collaboration with AI health researchers, is building prediction models that integrate polygenic risk scores with longitudinal fitness data.
Why Oxygen Transport Is the Master Regulator of Healthspan
Dr. Peter Attia has repeatedly emphasized that VO2max is the single most powerful predictor of all-cause mortality—stronger than smoking status, hypertension, or diabetes. A low VO2max doubles or triples the risk of premature death, while moving from the lowest fitness quintile to the next quintile confers a greater survival benefit than any pharmaceutical intervention.
The 2022 JACC Focus Seminar on exercise for primary and secondary prevention of cardiovascular disease reported that adherence to WHO physical-activity guidelines is associated with a 23–40 percent reduction in cardiovascular disease and a 27–31 percent reduction in all-cause mortality. [24] The relationship follows an inverse curvilinear dose-response pattern: the largest relative benefit comes from transitioning from inactivity to modest activity (30 minutes of walking per day), with continued but diminishing returns up to very high volumes of exercise.
Levine's two-year training study in middle-aged adults demonstrated that a structured protocol—including Norwegian 4×4 interval sessions at 95 percent of peak heart rate—reversed cardiac stiffness by the equivalent of 20 years. [25] The prescription was five to six hours of physical activity weekly, progressively structured over two years. This is not a weekend hobby; it is a medical intervention with an effect size larger than most drugs.
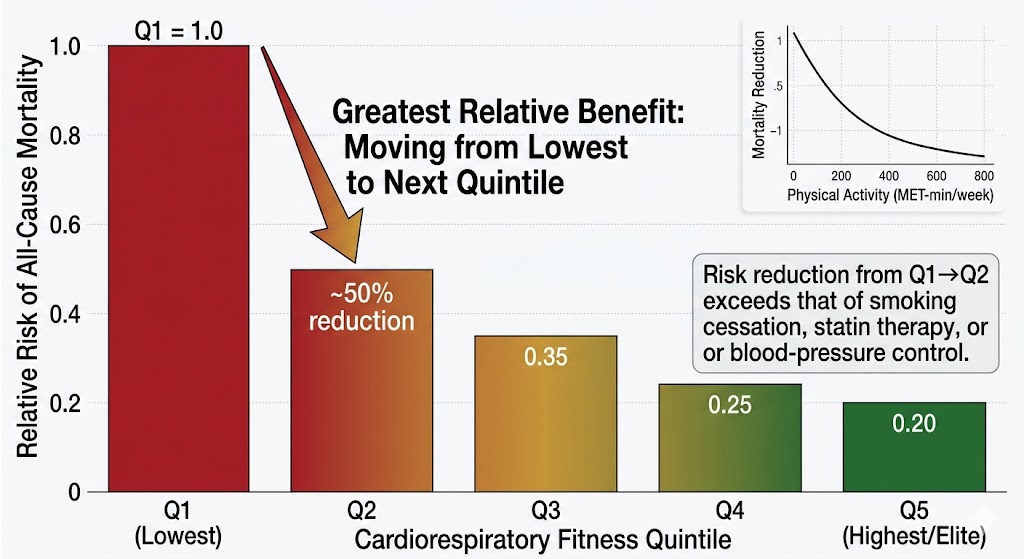
Figure 8. VO₂max is the most powerful predictor of all-cause mortality — surpassing smoking status, hypertension, and diabetes. Moving from the lowest to the second-lowest fitness quintile reduces mortality risk by approximately 50%, a benefit exceeding most pharmaceutical interventions. Sustained, data-guided exercise is arguably the most potent 'drug' available for extending healthspan.
Planning for one's longevity, therefore, is not a luxury—it is a physiological imperative. And the data to guide that planning has never been more accessible or more actionable.
Practical Recommendations: Monitoring Your Eight Indicators
For the reader who wants to act on this science, here is a framework organized by indicator and data source. The key principle is that no single measurement suffices; the power lies in integration across the eight-link chain, longitudinal tracking over months and years, and interpretation by both algorithms and human experts.
-
VO₂max: Get a gold-standard CPET test annually. Between tests, use Garmin or WHOOP estimated VO2max as a directional proxy. Track trends, not single values.
-
Cardiac Output / Stroke Volume: A baseline echocardiogram provides structural data (LV volume, ejection fraction). Wearable HR and HRV trends reflect autonomic inputs to cardiac function.
-
Hemoglobin / Oxygen-Carrying Capacity: Quarterly blood panels (Function Health, InsideTracker, or your physician). Monitor ferritin, transferrin saturation, and hemoglobin. Correct deficiencies aggressively.
-
a-vO₂ Difference: NIRS muscle-oxygenation sensors (Moxy Monitor, Train.Red) during interval sessions provide real-time extraction data. Combine with blood lactate testing.
-
VO₂ Kinetics: Track heart-rate-on-kinetics during standardized warm-up protocols. Wearable-derived time-to-plateau is a reasonable proxy for Phase II time constant.
-
Ventilatory Efficiency: CPET-derived VE/VCO₂ slope. Wearable respiratory-rate trends (WHOOP, Withings ScanWatch) for longitudinal tracking.
-
Capillary Density: Currently inferred from training history and NIRS desaturation kinetics. Direct non-invasive measurement remains a research-stage technology.
-
Mitochondrial Function: NIRS-based post-exercise recovery-rate protocols. Metabolomic panels (organic acids, acylcarnitines) offer biochemical proxies.
Conclusion: From Measurement to Meaning
A century ago, Archibald Vivian Hill won the Nobel Prize for his work on muscle heat production and oxygen consumption. Eighty years ago, the concept of VO2max was crystallized by researchers who had to collect expired air in Douglas bags and analyze it by hand. Fifty years ago, Saltin and Levine's Dallas Bed Rest Study revealed the terrifying fragility—and remarkable resilience—of the human cardiovascular system. Today, we carry on our wrists sensors that would have been the envy of a 1990s physiology laboratory.
The challenge is no longer data acquisition. It is data integration, interpretation, and action. The eight indicators described in this article are not academic abstractions; they are the vital signs of your oxygen-transport system, and collectively they predict how long and how well you will live. Monitoring them longitudinally, understanding which link in the chain is weakest, and intervening precisely at that point—this is the promise of AI-powered longevity planning. It is the promise of the Cardiorespiratory Digital Twin™.
The tools exist. The science is settled. The question is whether you will use them. As Benjamin Levine has said: "Exercise needs to be part of your personal hygiene." The data to guide that hygiene has never been richer. It's time to use it.
Author Biography

Tony Medrano is CEO and co-founder of LongevityPlan.AI, a platform that integrates performance and health data from athletes and leverages proprietary Cardiorespiratory Digital Twin™ technology, wearable data, and biomarker data to deliver personalized performance optimization and longevity recommendations to athletes, coaches, organizations, businesses, government, and the military. In addition to being a 3x technology / AI company CEO with 2 successful exits, Tony has also finished 3 Full Ironman Triathlons (140.6 mi) since 2019. He has degrees from Harvard University, Columbia University, and a JD/MBA from Stanford University. Tony has been involved with AI and molecular diagnostic start-ups for 10 years, and also worked with the US Olympic Team, National Basketball Association (NBA), National Football League (NFL), Major League Baseball (MLB), Iditarod, FBI, NASA, U.S. Department of Health and Human Services (HHS), Google, Microsoft, Netflix, Bridgewater Associates, ConocoPhillips, British Petroleum, One Medical, and Jenny Craig, Inc. to provide technology, artificial intelligence and/or molecular diagnostics solutions to their employees.
One of Tony's prior companies provided Conversational AI to health, fitness, and wellness companies; another delivered access to digital libraries of British Petroleum for oil discovery; and his first was a mobile app platform funded by Softbank, which resulted in a case study published by Stanford University Press, and was taught in multiple MBA programs for a decade. Tony loves to teach and mentor; he earned public school teaching credentials in NY and MA and taught inner-city high school students to give back to the underprivileged community in Harlem. He also lectured on entrepreneurship and venture capital to second-year MBA students at Stanford Business School for five years. He co-authored one of the first issued patents for mobile applications. Tony also served as a US Navy Officer commanding an emergency response team on a USN Destroyer. Tony's military-to-CEO career has recently been chosen to air on an episode of "Operation CEO" a documentary by InsideSuccess.TV, which will air on AppleTV, Prime Video & Amazon MGM Studios, YouTubeTV, and other major platforms worldwide in 2026.
Endnotes
[1] Saltin B, Blomqvist G, Mitchell JH, et al. Response to exercise after bed rest and after training. Circulation. 1968;37/38(Suppl VII):VII1–VII78.
[2] Mitchell JH, Levine BD, McGuire DK. The Dallas Bed Rest and Training Study: Revisited after 50 years. Circulation. 2019;140(16):1293–1295.
[3] Levine BD. What do we know, and what do we still need to know? J Physiol. 2008;586(1):25–34.
[4] Joyner MJ, Dominelli PB. Central cardiovascular system limits to aerobic capacity. Exp Physiol. 2021;106(12):2299–2303.
[5] Bacon AP, Carter RE, Ogle EA, Joyner MJ. VO2max trainability and high intensity interval training in humans: a meta-analysis. PLoS ONE. 2013;8(9):e73182.
[6] Bouchard C, An P, Rice T, et al. Familial aggregation of VO2max response to exercise training: results from the HERITAGE Family Study. J Appl Physiol. 1999;87(3):1003–1008.
[7] Heinonen I. Cardiac output limits maximal oxygen consumption, but what limits maximal cardiac output? Exp Physiol. 2025;110(5):666–674.
[8] Heinonen I. Ibid. See also: Martinez MW, Kim JH, Shah AB, et al. Exercise-Induced Cardiovascular Adaptations. JACC. 2021;78(14):1453–1470.
[9] Heinonen I, Kudomi N, Kemppainen J, et al. Myocardial efficiency and oxygen consumption in the trained heart. J Physiol. 2014;592(9):2037–2049.
[10] Levine BD, Baggish AL, Kovacs RJ, et al. Eligibility and Disqualification Recommendations for Competitive Athletes with Cardiovascular Abnormalities. JACC. 2015;66(21):2343–2349.
[11] Martinez MW, Kim JH, Shah AB, et al. Exercise-Induced Cardiovascular Adaptations and Approach to Exercise and Cardiovascular Disease: JACC State-of-the-Art Review. JACC. 2021;78(14):1453–1470.
[12] Joyner MJ, Casey DP. Regulation of increased blood flow (hyperemia) to muscles during exercise: a hierarchy of competing physiological needs. Physiol Rev. 2015;95(2):549–601.
[13] Bassett DR, Howley ET. Limiting factors for maximum oxygen uptake and determinants of endurance performance. Med Sci Sports Exerc. 2000;32(1):70–84.
[14] McGuire DK, Levine BD, Williamson JW, et al. A 30-year follow-up of the Dallas Bed Rest and Training Study: I. Effect of Age on the Cardiovascular Response to Exercise. Circulation. 2001;104(12):1350–1357.
[15] Hellsten Y, Nyberg M, Jensen LG, Mortensen SP. Vasodilator interactions in skeletal muscle blood flow regulation. J Physiol. 2012;590(24):6297–6305.
[16] Poole DC, Jones AM. Oxygen Uptake Kinetics. Compr Physiol. 2012;2:933–996.
[17] Poole DC, Jones AM. Ibid. See Section: Disease States.
[18] Jones AM. The physiology of the World Record holder for the women's marathon. Int J Sports Sci Coaching. 2006;1(2):101–116.
[19] Baba R, Nagashima M, Goto M, et al. Oxygen uptake efficiency slope: a new index of cardiorespiratory functional reserve derived from the relation between oxygen uptake and minute ventilation during incremental exercise. J Am Coll Cardiol. 1996;28(6):1567–1572.
[20] Saltin B, Gollnick PD. Skeletal muscle adaptability: significance for metabolism and performance. In: Handbook of Physiology. Section 10. Bethesda, MD: American Physiological Society; 1983:555–631.
[21] Laughlin MH, Davis MJ, Secher NH, et al. Peripheral circulation. Compr Physiol. 2012;2(1):321–447.
[22] Yan Z, Lira VA, Greene NP. Exercise training-induced regulation of mitochondrial quality. Exerc Sport Sci Rev. 2012;40(3):159–164.
[23] WHOOP Inc. WHOOP 5.0 Technology Overview. whoop.com. Accessed 2025.
[24] Pelliccia A, Sharma S, Gati S, et al. 2020 ESC Guidelines on sports cardiology and exercise in patients with cardiovascular disease. Eur Heart J. 2021;42(1):17–96. See also JACC Focus Seminar series on Exercise and CVD, JACC 2022;80(12):1171–1190.
[25] Howden EJ, Sarma S, Lawley JS, et al. Reversing the cardiac effects of sedentary aging in middle age—a randomized controlled trial. Circulation. 2018;137(15):1549–1560.